logo
  • Industries
    • Healthcare
    • Telecom & Media
    • Retail
    • Technology
    • BFS
    • Insurance
    • Utilities
    Linkedin-new-icon Instagram-Icon Facebook-Icon Youtube-Icon
    Navigation-Bottom-Element

    Explore our Services

    Digital CX

    • Omnichannel CX
    • AI Operations & Bots
    • Social Experience Management
    • SupportPredict Self Learning Knowledgebase
    • SupportPredict Agent AI
    • SupportPredict Self Service & Bots

    Resolution-Centered CX

    • Customer Acquisition
    • Customer Care & Retention
    • Account Management
    • Complaints Management
    • Technical Support
    • Billing & Collections
    • Back Office Processing

    Analytics & Consulting

    • Data Visualization
    • Advanced Analytics
    • Speech Analytics
    • Business Process Optimization
    • Business Transformation
    • Customer Journey Mapping

    Healthcare

    • Member Acquisition
    • Member Services
    • Provider Services
    • Improving Health Outcomes
    • Healthcare Advocacy
    • CMS Stars
  • Outcomes

    Helping you drive competitive advantage

    Business Outcomes

    Revenue Acceleration

    • Sales Acceleration
    • LTV Maximization

    Cost Optimization

    • IntelliAgent
    • Workforce Management
    • Process Consulting & Excellence
    • AI & Data Ops
    • Performance Analytics
    • Agent Health & Wellness

    Enhanced Experience

    • Social Experience Management
    • Omnichannel & Intelligent Steering
    • NPS Predictor
    • Churn Reduction
    • FCR Booster
    Linkedin
  • Locations

    Discover our global network locations

    • United States
    • Honduras
    • Mexico
    • Work from home
    • EMEA
    • United Kingdom
    • Ireland
    • Bulgaria
    • South Africa
    • India
    • Philippines
    Linkedin Instagram-Icon Facebook-Icon Youtube-Icon
    Navigation-Bottom-Element
    Location1-img
    Location2-img
    Location3-img
    Location4-img
    Location5-img
    Location6-img
  • Insights

    Stay informed. Stay ahead.

    • All
    • Blogs
    • Case Studies
    • Healthcare Insights
    • Videos
    • Whitepapers
    • Glossary
    Latest whitepaper

    Reimagine Customer Experience Management on Social Media

    Download
    Navigation-Bottom-Element
    Linkedin Instagram-Icon Facebook-Icon Youtube-Icon

    Business outcomes
    that underpin your growth

    Watch video
  • Careers

    Experience a new world of work

    • Life @ ResultsCX
    • Our Values
    • Careers Blog

    Explore Opportunities

    • United States
    • Honduras
    • Mexico
    • Philippines
    • Bulgaria
    • India
    Navigation-Bottom-Element
    Linkedin Instagram-Icon Facebook-Icon Youtube-Icon
  • ESG

    For a better tomorrow

    • Environmental, Social, And Governance
    • Corporate Social Responsibility
    • R.E.A.L. Women
    Navigation-Bottom-Element
    Linkedin Instagram-Icon Facebook-Icon Youtube-Icon
  • Why ResultsCX

    The ResultsCX difference

    • About us
    • Our Story
    • Leadership
    • R.E.A.L. Women
    • Technology Partners
    • Awards
    • News
    • Technology & Security
    Navigation-Bottom-Element
    Linkedin Instagram-Icon Facebook-Icon Youtube-Icon

    Values that guide
    our teams everyday

    Watch video
  • UK / EMEA

    UK/EMEA

    • Banking
    • General Insurance
    • Consumer Credit
    • Fintech
    • Utilities
    • Private Equity
    • Start up/Scale up
    Navigation-Bottom-Element
    Linkedin Instagram-Icon Facebook-Icon Youtube-Icon

    Values that guide
    our teams everyday

    Watch video
talk to us
Home
Glossary
Data Visualization

Data Visualization

What is Data Visualization?

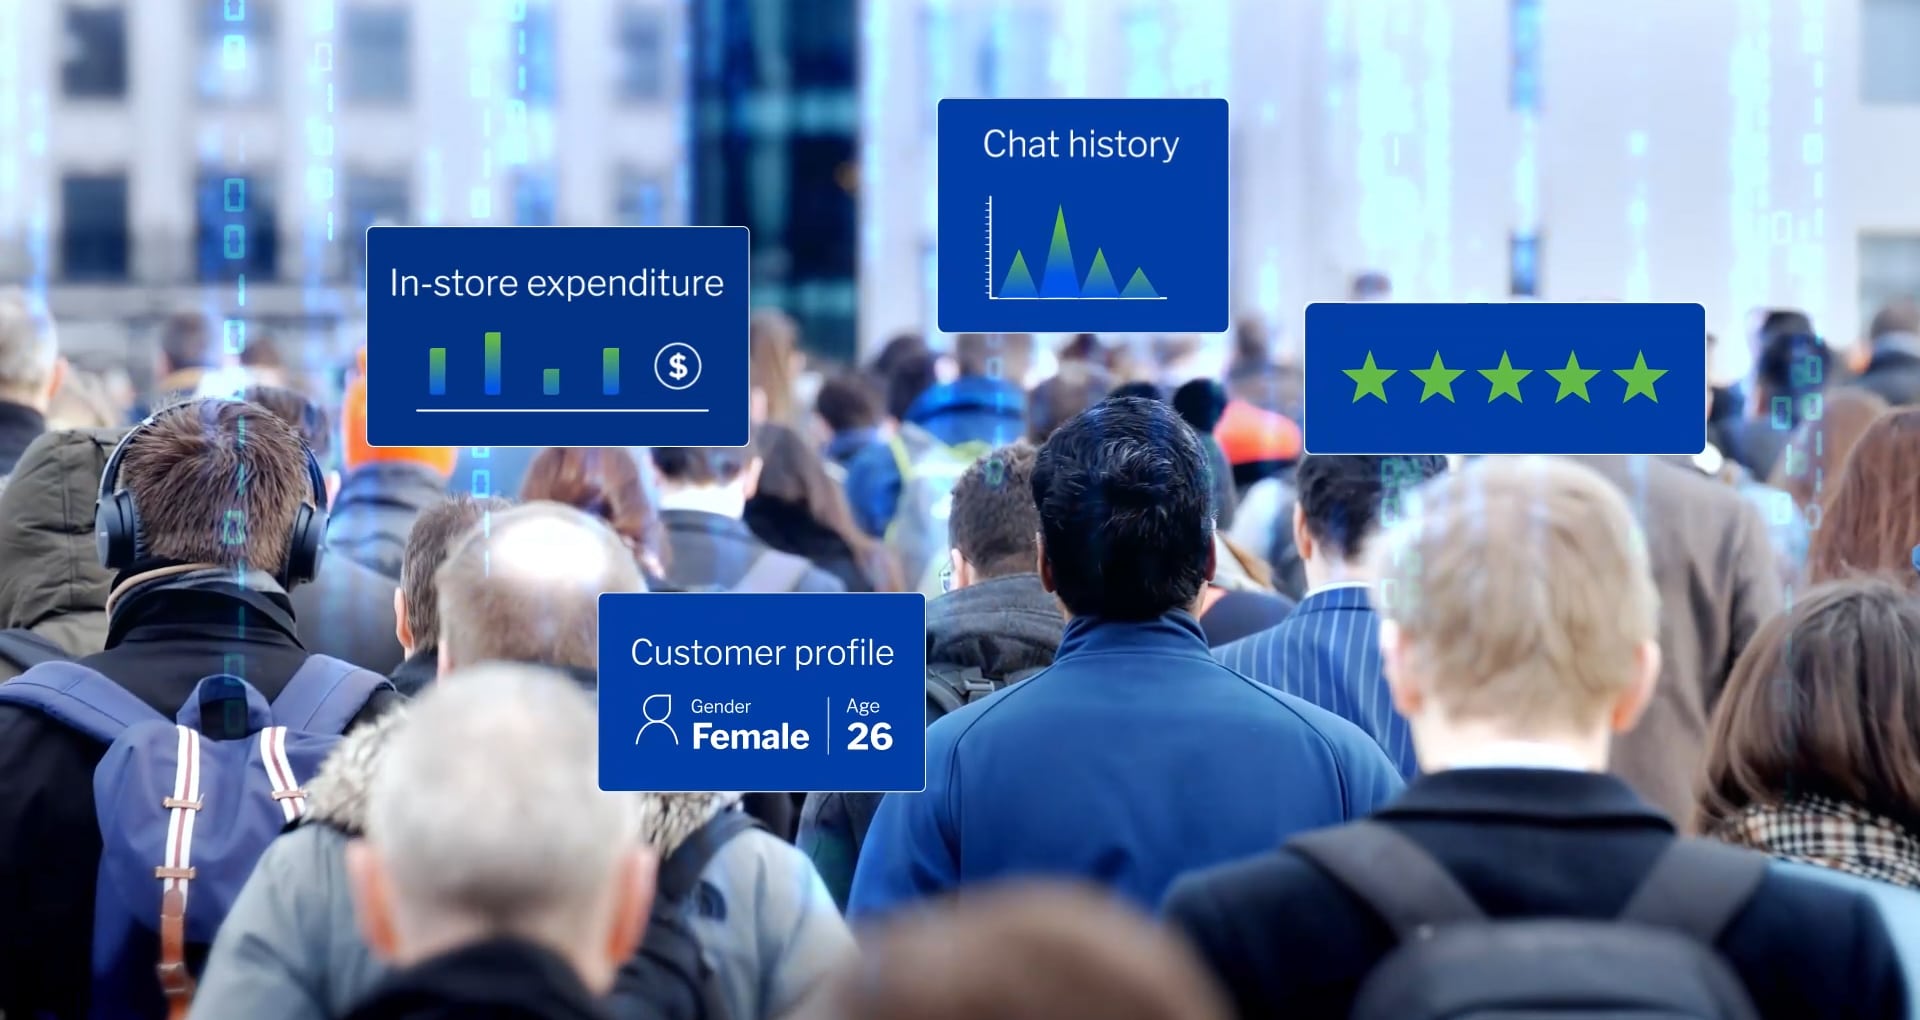
Data visualization is representation of data using visual elements like charts, plots, graphs, infographics and so on. The visual representations help communicate complex data-driven insights such as trends, outliers, and patterns in an easy-to-understand manner. With nearly 330 Mn Terrabytes of data generated every day, data visualization tools and technologies are essential to analyzing massive amounts of data and information flowing through an organization and making data-driven decisions.

AC-Data-Visualization

Benefits of Data Visualization

DataOps provides the tools, operations, and organizational structures to support analytics, in turn creating a data-driven organization. Benefits include:
  • Automated reporting. Enable contextualized data and information for superior decision making by using data visualization dashboards.
  • Easier trend analysis. Analyze current and historical data, see trends and patterns to predict the future like potential growth or declining revenues.
  • Understand customer behavior. Use sentiment analysis and customer segmentation to dig deeper into how your customers feel about your brand and identify correlations.

Data Visualization use cases

Operational analytics

Track key performance indicators (KPIs), proactively identify issues, and pinpoint areas of improvement.

Risk management

Identify risks early on before they turn into problems, improve quality and compliance.

Service excellence

Use the voice of the customer (VOC) to adapt to evolving customer requirements.

Social media analysis

Make sense of huge volumes of texts and unstructured data generated on social media platforms to improve engagement and CX.

Data Visualization: Featured content

Analytics-and-consulting
Play Video
Get Your Data Working For Your Business
Play Video

Video

May 21, 2023

Analytics-Boost-Customer-Retention

Analytics Boosts Customer Retention and Increases Annual Revenue by $1.27 Million for Streaming Media Giant

Operational Excellence

Case Study

March 15, 2023

Leading-Retailer-Leans-into-Customer

Leading Retailer Leans into Customer Interaction Analytics to Improve CSAT by 91%

Customer Journey Mapping

Case Study

March 15, 2023

Data Visualization related solutions

Use data visualization tools and technologies to reduce risks and drive service excellence.

Advanced-Analytics-Banner

Data Visualization Solutions

Customer-Journey-Mapping-Banner

Customer Journey Mapping

Analytics & Consulting

redefine-customer
Redefine
Customer
Experience
Strategies

Talk to us

Home
Outcomes
Insights
Careers
ESG
About Us
Contact

©2023 All Rights Reserved. ResultsCX

Privacy Policy
Site Map